Reports
Menu Items |About Reports | Types of Report
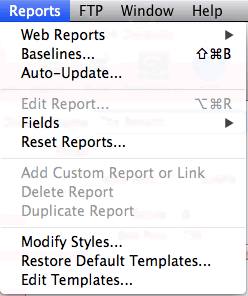
 Web Reports This is a sub-menu item with the following items:
Build Web Site... Creates Web files (HTML) to be uploaded to your Web Server (or for distribution via email). All checked reports under the Available Reports list will be created. (Identical to selecting the the Build Website... button from the Reports screen)
A dialog will be presented asking you to select a folder in which to save these files on your hard drive.
ReBuild Entire Web Site... Once you have chosen Build Web Site for the first time, this will become active. Now you can select this item and all your files will be re-generated into the folder you selected from the last build.
Save As... Active when a report is selected. This allows you to save individual, selected reports instead of building all reports.
Reports can be saved as web pages (HTML), text or Excel format. (Identical to selecting the Save As... button from the Reports screen)
Preview... Active when a report is selected. This allows you to see a Web Preview of the selected report. (Identical to selecting the Preview... button from the Reports screen)
Auto-Update... Used to automatically update your results and upload (or save) your selected reports to a web server or folder on your hard drive.
Baselines... Used to populate the Standings report Change field. See OfficePool built-in help when selecting this menu item for more information.
Edit Report... Presents a dialog which enables you to change the following report attributes: Name and Web/Print Title. (This is the same as double-clicking on a report from the Available Reports list)
Fields This is a sub-menu item with the following items:
Edit Field... Presents a dialog which enables you to change the following report field attributes: Name, Column Title, Width and Alignment. (This is the same as double-clicking on a report from the Fields list).
The Width attribute is a relative length attribute. So, for example, if you enter a "5" for Entry Name field and a "1" for Score field then the Entry Name column will be 5 times the width of the Score field.
Check All Checks all the available fields for the selected report.
Uncheck All Unchecks all the available fields for the selected report.
Toggle Selected Changes the state of the selected fields. (e.g. if the field is checked, it will become unchecked)
Reset Reports... Reverts all reports and field settings back to the OfficePool defaults.
Add Custom Report or Link Creates a new custom report similar to the built-in Rules report. These types of reports allow you to create extra web pages. These reports might contain rules for you pool, an introduction or an Index to all the reports. These reports also show up in the navigation menu which is included on all reports.
You can also create a link to the Popup menu built within the reports by typing a link in the "Name or Link" field.
Delete Report Active only for reports you have created using either Duplicate Report or Add Custom Report. This allows you to remove these reports. Simply unchecking them may be a better approach however.
Duplicate Report Active only when the built-in Standings report is selected. This allows you to make a copy of the report and then select other fields to create your own custom report. No single report will contain all the fields available but you may want to create multiple reports with a few selected fields. (Same as selecting the Duplicate button from the Reports screen)
NOTE: The Bracket Index and Possible Outcomes reports are actually duplicated reports of the Standings report. In fact, these two built-in reports can be deleted.
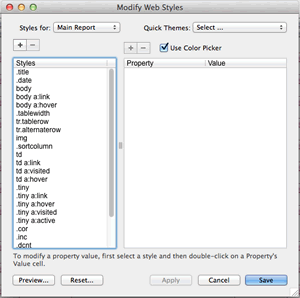
 Modify Report Styles... and Modify Bracket Styles... Allows you to change the look and feel of your
OfficePool generated web reports. All reports use Cascading Style Sheets (CSS) and this tool allows you to modify these styles.
These can also be changed from the Edit Templates... menu item.
NOTE: Descriptions are shown at bottom of window when a style is selected.
Restore Default Templates Restores the templates to their default states. Once a files is saved, this can not be undone. (Close the files without saving to undo this change)
Edit Templates... Allows editing of CSS Styles and templates used to create the OfficePool web pages. Be careful when editing this information. If you are not familiar with HTML editing, this feature is not for you.
Easiest way to edit these files is to copy/paste the text into an HTML Editor, otherwise it's best to use the Modify Styles... menu item and pick one of the built in themes.
Brief Description of How Reports Work
This is the area where you generate output of all the information you gathered from the Brackets area. At least one bracket must be created to access this area.
There are two lists on the Reports area: Available Reports and Fields. When you select a report from Available Reports then the Fields list is populated with the report's available fields.
Reports can be re-ordered by selecting a report and then dragging it to a new position. The order of reports from this list is the same order of how your navigation menu is populated on your Web reports.
Checked reports are the only ones created from the Build Web Site menu item. The navigation (i.e. Popup menu) menu on each report is also populated with only checked reports.
Fields can be re-ordered in the same way as reports -- select a field and drag to new position. Checked fields are the only ones which will appear on the selected report.
Other Items of Note and descriptions of reports
- The Options button brings up the Preferences window and selects the Reports tab.
- The Standings report shows the current Standings based on The Results entry.
- The Possible Outcomes report shows the current possibilities based on The Results entry. Must have at least one entry and have completed the second round of games (i.e. 16 teams or less are left in the tournament).
- How many possible outcomes does your pool have?
Mathematically speaking, you have 2 to the power of n, where n is the number of teams left in the tournament minus one. For example, if there are two teams left, there are 2 raised to the power of 1 which equals 2 possible out comes. Four teams left would be pow(2, 3) = 8 possible outcomes. 16 teams left would be pow(2, 15) = 32,768 possible outcomes. With 32 teams left there would be 2.1 Billion outcomes, which is why the outcomes are only calculated until there are 16 teams or less. - The Possible Outcomes and Money columns are based on what is entered under the Payouts tab under the Preferences dialog.
- The Summary of Picks report displays how many times each tournament team has been selected by your pool brackets for each round. Round 6 is really the Championship game. Round 5 is the Finals, Round 4 is the Final Four, etc.
- The What If Scenarios report is only available when The Results has only four or two teams left. For each possible outcome, the full standings are displayed. So when there are four teams left, that would make eight possible outcomes. This reports helps eliminate the always annoying questions of "What needs to happen for me to finish first?"
- The Compare Brackets report allows you to compare multiple brackets side-by-side. Select the Compare Brackets... button and now you have a side-by-side comparison of all 63 picks for the selected brackets.

